
Data can be a useful tool to inform and strengthen your advocacy, but it can be intimidating to navigate. Find out how to find the most commonly requested data.
Always remember, Florida is the Sunshine State – you can submit a public records request to any state or local agency or board. A public records request can begin as simply as emailing who you think may have the information – they should direct you to how to submit a request.
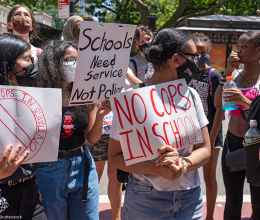
How many School Resource Officers are employed in my district?
Each year, the Florida Department of Education’s Office of Safe Schools publishes information about the State’s Safe Schools Appropriation, which partially pays for school resource officers. Look for the Safe Schools Appropriation Expenditures Report, which outlines how many school resource officers are employed in each district.
To find out more detailed information about the number of law enforcement officers at local schools in your district, contact your local Superintendent.
How many School Counselors and other mental health professionals are employed in my district/school?
Florida’s Department of Education publishes staffing reports online. Look for “Staff in Florida's Public Schools, District Reports or School Reports.” The excel files usually have tabs labeled “Staff by Activity,” which will outline how many mental health professionals are employed.
You can also find out salary information here.
For my school/district, how many students are:
Disciplined: The Florida Department of Education publishes annual student reports, including a discipline report. This report usually breaks down discipline by type and by student demographics. To calculate discipline rates, you’ll need the school enrollment numbers, which are available on the same page under “Enrollment.” Make sure you are comparing figures for the same year; discipline data tends to lag behind so get the proper year’s data from the archive.
Referred to Law Enforcement: The US Department of Education’s Office for Civil Rights, publishes the Civil Rights Data Collection. The data is delayed, but informative. It includes data on law enforcement referrals at the school, district and state level and you can analyze this data using student demographics.
Arrested at School: The Florida Department of Juvenile Justice publishes an interactive report on Juvenile Delinquency in Schools. You can analyze this data by some student demographics. To analyze school arrest disparities on students with disabilities, visit the US Department of Education’s Office for Civil Rights, publishes the Civil Rights Data Collection. The data is delayed, but informative. It includes data on school-based arrests at the school, district and state levels and you can analyze the data by disability status, as evidenced by Individualized Education Plans.
How do I calculate rates?
Divide the total number of outcomes by the total population, then multiply by 1,000.
For example, to determine the school arrest rate:
|
School-related arrests |
x |
1,000 |
|
School Population |
|
8,149 |
x |
1,000 |
|
1,447,491 |
School-related arrest rate: 5 arrests per 1,000 students
For smaller numbers, you may need to multiply by a larger number to get meaningful rates.
How do I find data about disparate treatment?
Divide the rate of discipline for the demographic you suspect may be disparately impacted by the rate for the demographic you believe is not. This gives you the Relative Rate Index, or RRI. An RRI of 1 means that both groups are equally affected. An RRI of more than 1 means that the suspected disparately impacted group is that number times as likely to be affected than the other group.
For example, to find the disparate impact of school expulsions on black students,
|
Expulsion Rate for Black Students |
|
Expulsion Rate for White Students |
|
3.8 |
|
1.9 |
Which gives us an RRI of 2, so black students are twice as likely to be expelled as white students.
Where can I find data about LGBTQ youth?
Florida’s Department of Education and the US Department of Education’s Office for Civil Rights do not include that information on their reports. The Centers for Disease Control and Prevention publishes results from the Youth Risk Behavior Surveillance System, which includes LGB students and can be analyzed at the state level. This report does not cover school discipline or arrests but can be insightful for how LGB youth experience school. You can learn more about disparate impact on LGBTQ students and available national reports here.